How to Use Visual Content While Blogging

2017.07.21
 (12 votes, average: 5.00 out of 5)
Visual content has become an inseparable part of a popular and influential blog, and today we’ll share how to profit from it. We’ll also give you ideas on the services you can use to save time when searching for or creating visual aids for your blog or website.
How important is visual content
You most certainly know that any blogger should include visual content in the blog. But do you know for sure, why? Here are the answers with some statistics and scientific data:
- The majority of the information that gets to the brain is visual
- Marketing research demonstrates, that people tend to be more responsive to one single image than to a 1000-word text
- Articles that contain infographics perform 12% better than those that don’t
- People who watch a video of a company’s product demonstrate 85% more chances to buy that product later
- Readers spend twice more time on pages with videos
- Our brain keeps 10% of the information we hear, 20% of the info we read and 80% of the info we see
In addition, numerous neurological and psychological studies confirm that visual data improves both understanding and remembering. It also attracts attention and increases the chances that the readers will remember the information you provide. So next time you make your content plan, make sure to think over a visual content strategy and brainstorm the ways to enliven your texts using visuals.
Visual content types to use in your blog
Visual aids go far beyond the simple usage of images. There is actually an entire range of visual content types and each of them can be used to support and demonstrate your ideas in the best way.
Images
Compelling, contextually appropriate images will make a great change to your blog post. First of all, they prevent the text from looking bulky and too hard to read. Secondly, they help readers stay interested for a long time and increase the chances they will read the post up to the end. It’s especially significant in the era of mobile devices, as users tend to get distracted easily and their attention span is extremely short, shorter than ever before, actually.
Besides, blog posts accompanied by photos demonstrate 30 times more reads and 40 times more shares.
To make the most of the images try to include the ones that are highly appropriate to the text and have some personal style relevant to your blog. And, surely, the photos should be original and of a good quality.
Videos
Though videos may be one of the most expensive and time-consuming content types, using them does pay off. For instance, if a landing page includes a video, its conversion increases by 86%, and blog posts with a video get 300% more backlinks.
Depending on your blog’s main topic you can create all kinds of audio visual content: how-to and explanatory videos, testimonials of your most loyal clients, for example.
Don’t forget that video content marketing is becoming more and more popular, YouTube is the second largest search engine in the world, videos will represent 90% of all online content by 2019. Hop on while you can! Start creating videos for your blog, making your content more valuable and prepare a base for future growth.
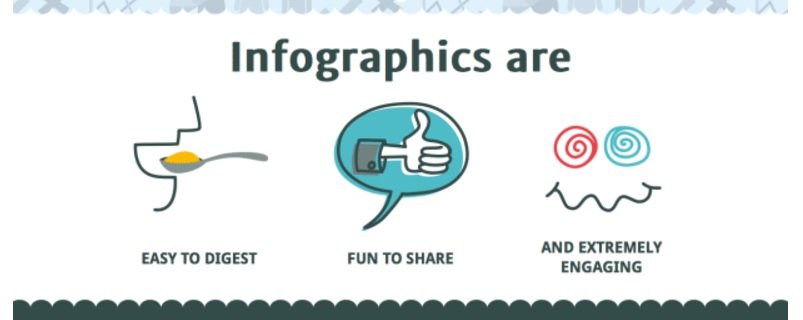
Infographics
This is the case when a picture is worth a thousand words. When you are dealing with a large amount of data or statistical information the best way to draw users attention may be by creating an infographic. 80% of people admit having more desire to read the info in a form of colored visuals.
Moreover, 67% of readers find texts supported by visuals convincing in comparison with 50% of those who find purely textual information credible.
Presentations
Similarly to infographics, presentations can help you with engaging the audience. In cases when you can’t represent your idea in short and fit it in one infographic, presentations come to rescue. They allow you to develop the thoughts step by step giving the info in small digestible portions.
Remember a few things when sketching your presentations: avoid making them too wordy, be consistent with fonts, colors, and design within one presentation.
If possible, add a bit of humor, don’t create a presentation as if you are doing it for your boss, keep in mind that positive emotions make the information stick better.
Screenshots
These are going to be very helpful when you try to explain how certain things work or show the steps to take with a program, website or service. It’s also much easier to make a point with the support of visual proofs.
Don’t neglect the use of screenshots when you have a chance to demonstrate the quality and effectiveness of your business. Use them to share screenshots of users’ testimonials or statistics of your business performance that only you can access.
Data visualization
You can use it together with your infographics and presentations or as a standalone argument. Drawings, charts, and diagrams allow us to process a big amount of data by glancing at it.
What you improve with visuals
When you add visual content to your blog not only it becomes more attractive, but you also start noticing positive effect it has on your blog’s performance. This quite often results in a positive outcome for your business as a whole. Let’s dig in a bit deeper in it.
- You get more click-throughs
Like we said before, blog posts containing visual content in them, generate more attention from the audience. Introduce the article with an appealing picture and an eloquent title and readers will hurry to see what’s inside.
- You get more shares
If you produce content that’s relevant enough for the readers AND add visuals to make them read up to the end, you’ll almost undoubtedly win the race for more audience engagement.
- You get to the point by saying less
When you get rid of wordy texts and let the visual content speak, you realize that you don’t need to write ten pages of text to make a point. Visuals help you find contact with the readers in a much shorter time with much fewer efforts from their side.
- You make your blog memorable
Whether you write a blog as a part of your company’s content marketing campaign or in an attempt to monetize it, you would want your readers to remember it and to come back to you later. Visual content is a powerful tool to achieve this goal, especially if you choose to create unique visuals for each of your blog posts.
Tools to create visual data
It’s true that the process of visual content creation is time-consuming, so here are several resources you can use to find or create visuals for your blog:
Piktochart

An easy service that allows you to create infographics and charts. It has a variety of features that make it easy to structure the information and make it clear and concise. You can join it and use the main tools for free. However, if you want to get access to the full template base, create your color schemes and make use of some other features, you will need to upgrade.
Infogr.am
Helps to make interactive infographics, charts, and maps, add images and videos, so the data created in Infogram looks really impressive. The only thing is that you need to upgrade to use these features, as with a free plan you can’t even download the project you’ve created.
Canva
Incredibly useful tool, that allows you to create almost any type of visual content you may need while blogging: infographics, email templates, designs for newsletters, images for Facebook or Twitter and much more. Once you’ve signed up, you get free access to all the tools, but if you need you can buy additional images or elements.
PowerPoint
![]()
Use a desktop version or a cloud version on Google Drive to make slides for your presentation. It’s totally free and very simple to use if you need to present a big amount of information gradually and systematically.
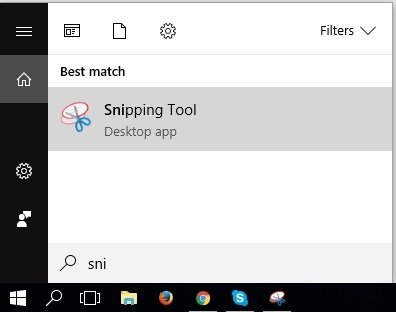
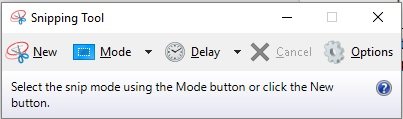
Snipping Tool on Windows
Snipping Tool comes to your rescue when you need to make screenshots to prove a point. It is included in all the versions of Windows starting with Windows 7. You can access it by searching for the app on your computer:
After that simply press “New” and choose the place you need a screenshot of and copy or save it:
More tips on using visuals in blog posts
- Use the Rule of Thirds. You may have noticed that 3×3 grid when you took a photo with your camera or phone.
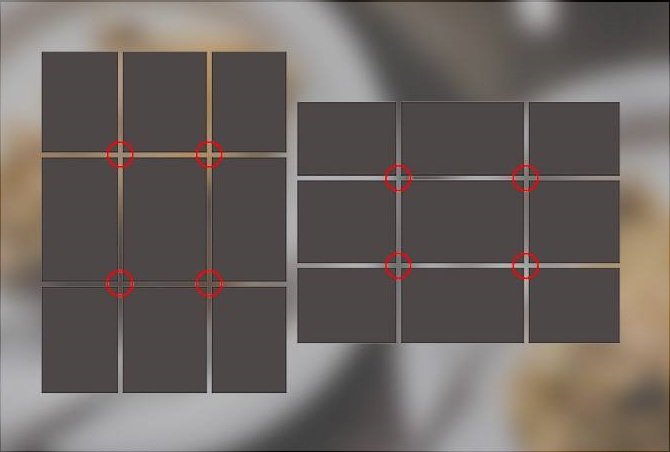
The Rule of Thirds says that we perceive the elements that are located at the intersection of these lines much better. Photographers actively use it in their work and you should try, too. Place the key information on the place of those invisible lines when creating a visual.
- Choose a color palette for your brand and stick to it. This way your users will start to identify your posts with your blog and your blog with your company.
- Use fonts consistently. Just like with colors, the constant use of the same fonts helps your target audience identify your brand and distinguish it from others.
- Create a visual content calendar. As it takes some time to create visuals for your blog, have a look at your content plan and brainstorm for essential ideas for each of the future posts.
- Add humor to the visuals where possible. The importance of images and other visuals lies also in the fact that they can entertain and engage your audience. When you make the information more fun, it generates positive emotions in the readers and helps them remember you.
We hope this blog post has given you some ideas on visual content use. Let us know if there are some other tips or tools you find helpful. Which visual content type do you find the most effective? Share with us and our readers in the comments below.